Management Dashboard
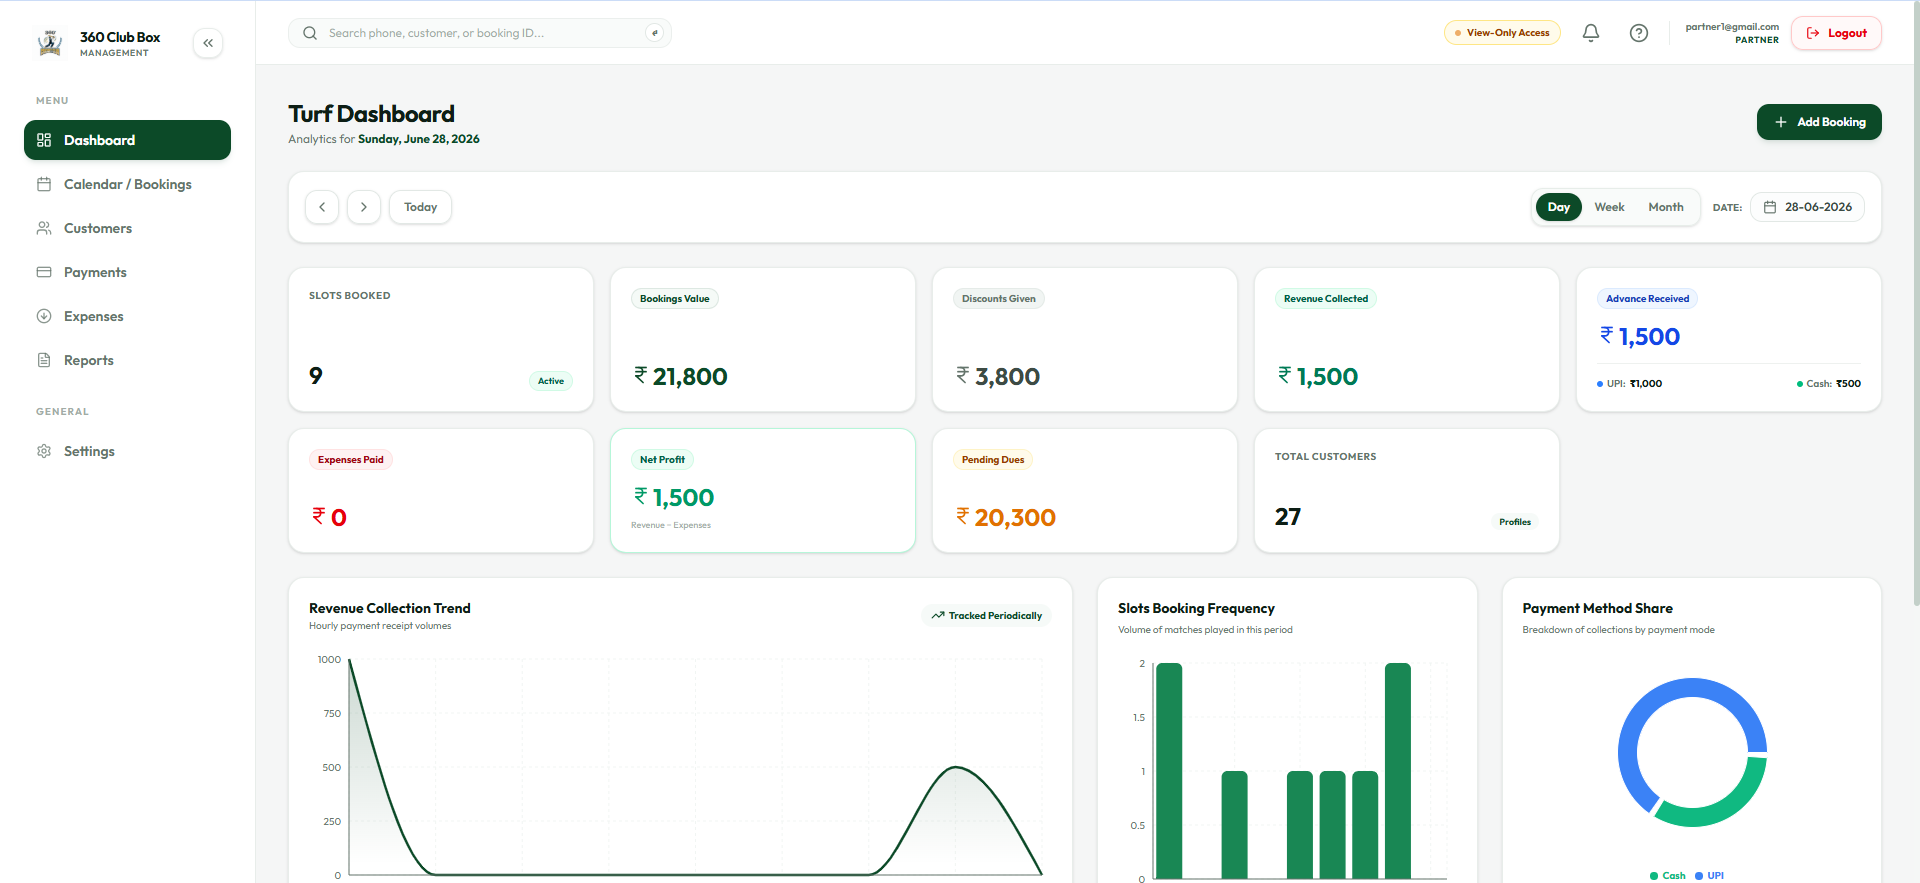
A comprehensive administrative panel for managing users, operations, and business performance metrics.
System monitoring
Avg. API latency
Control & reporting
Problem & Context
A specialized enterprise dashboard built to give business operators an all-in-one control center for monitoring active users, tracking transactional bookings, auditing system logs, and visualizing revenue trends in real time.
Operators lacked an unified view of business performance, requiring multiple disconnected logins to manage systems and users, leading to data inconsistencies and delayed operational decisions.
Engineering Strategy
Engineered a centralized dashboard aggregating system logs, active user management, role permissions, and key performance metric charts into a low-latency, modular React interface.
React frontend utilizing state management with high-performance chart libraries for real-time visualization. RESTful API service communicating with SQL/NoSQL databases with server-side caching to maintain sub-100ms response latencies.
Architectural & Technical Choices
Implemented optimistic UI updates on data modification to provide instant visual feedback to operators.
Structured modular widget architecture allowing administrators to rearrange dashboard cards based on role priority.
Engineered automated audit logging to capture all data modification events for compliance and security.
Engineering Challenges Overcome
⚠️ Challenge: Rendering dense data tables and time-series charts without freezing UI threads.
✓ Solution: Implemented table row virtualization and debounced chart rendering to maintain 60 FPS scrolling even with thousands of rows.
⚠️ Challenge: Enforcing granular permission boundaries between operational staff and executive managers.
✓ Solution: Built hierarchical Role-Based Access Control (RBAC) middleware verifying permissions at both route and component levels.